Financial statement analysis is one of the main methods used to evaluate companies. Various financial ratios and analytical techniques can effectively demonstrate a company’s financial performance. This process helps owners and organizational managers make better decisions and improve their financial position.
Negar Economic Development Group, leveraging its team’s expertise in finance, holding management, and information technology, has designed and implemented management and analytical dashboards for corporate financial statement analysis using Microsoft Power BI.
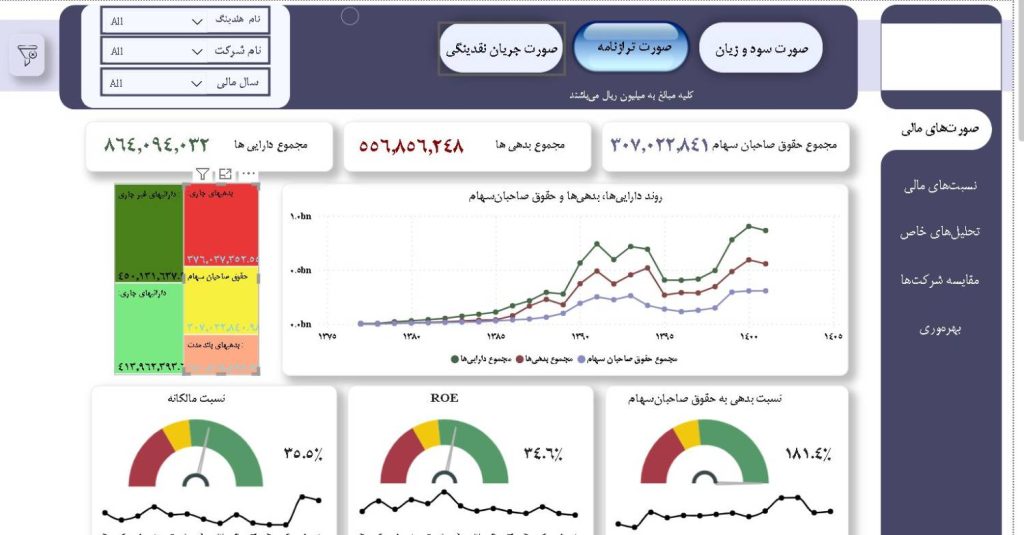
Based on the data from balance sheets, income statements, and cash flow statements of companies, the system enables the presentation of various horizontal and vertical analyses, financial ratios, and the application of annual adjustment coefficients.
Additionally, more than 30 key indicators in the areas of profitability ratios, activity, liquidity, leverage, and financial performance are calculated and visualized. It is also possible to track the periodic performance trends of each company.
For holding groups and parent organizations, it is also possible to compare, view, and analyze the financial information of all their subsidiary companies.
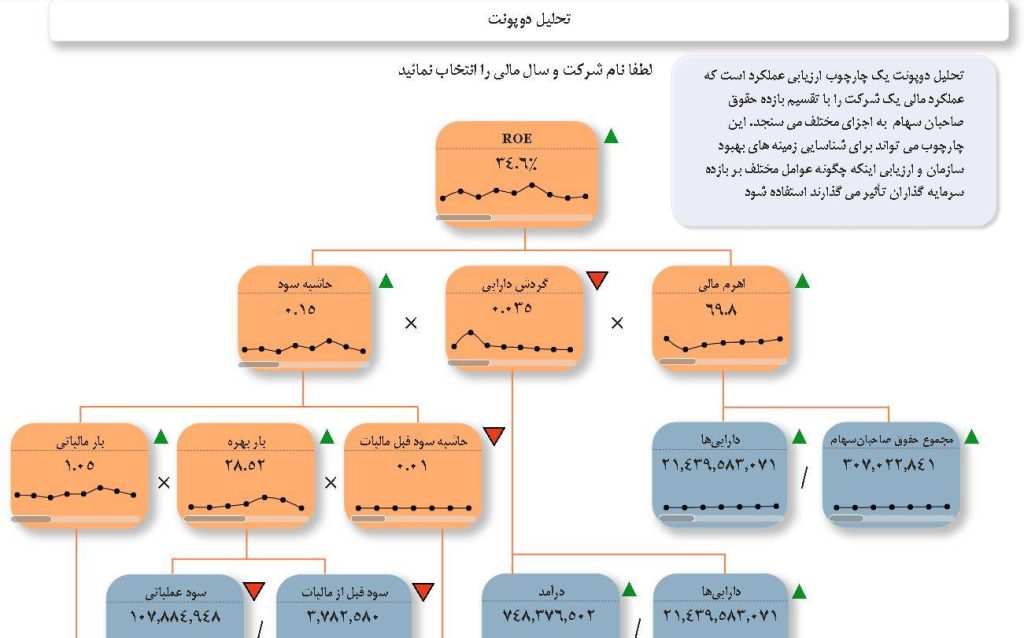
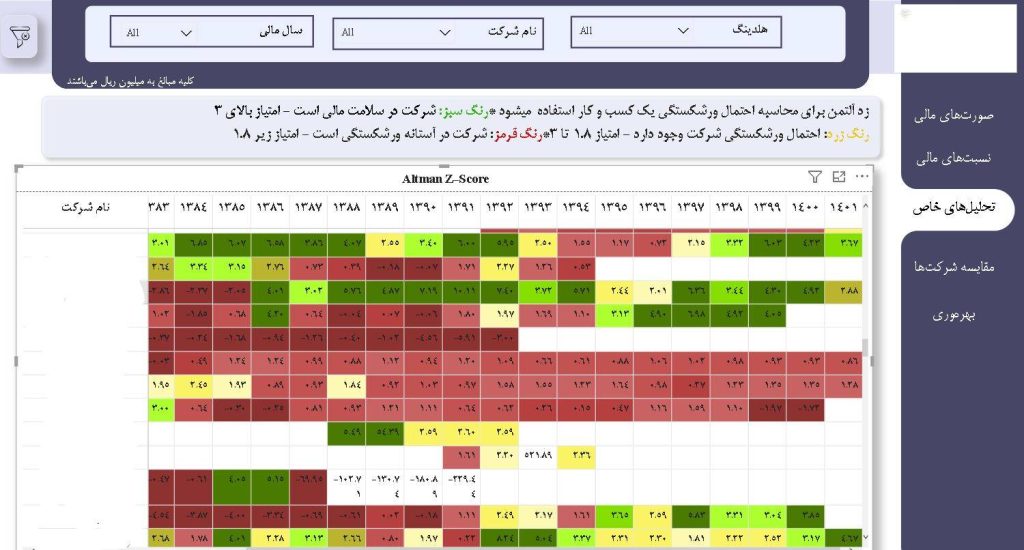
Specialized analyses such as Altman Z-Score, DuPont Analysis, and others are also provided, offering valuable insights for financial analysts in both subsidiaries and parent organizations.